Easing Charts
Two keyframes say where an animation starts and ends. Easing says how it gets there — at a constant pace, accelerating, slowing into the end, overshooting. The right easing is what makes motion feel natural instead of mechanical.
In Pixodesk SVG Animator every segment between two keyframes has its own cubic bezier curve. You see it in the Chart Panel and shape it in the Easing Function panel.

How Easing Works
Section titled “How Easing Works”The Chart Panel
Section titled “The Chart Panel”The right part of the timeline draws the selected properties over time, as up to three curves:
- Value — the property itself; always shown.
- Velocity
ƒ′(t)— how fast it changes; peaks show the fastest moment. - Acceleration
ƒ′′(t)— how the speed changes; spikes reveal abrupt starts and stops.
The ⋮ menu of the Chart Panel toggles the Velocity and Acceleration charts and Show values on multiple scales, which gives each curve its own scale when properties with very different ranges (pixels vs percent) are shown together. Selecting several animated properties draws all their curves in one chart, so you can line up timings — an opacity fade ending where a scale change starts.
Segments and the mini charts
Section titled “Segments and the mini charts”Between any two keyframes the timeline shows a mini chart of that segment’s easing. Click the segment: it is highlighted, the Chart Panel zooms to it, and the Easing Function panel opens.
Easing Presets
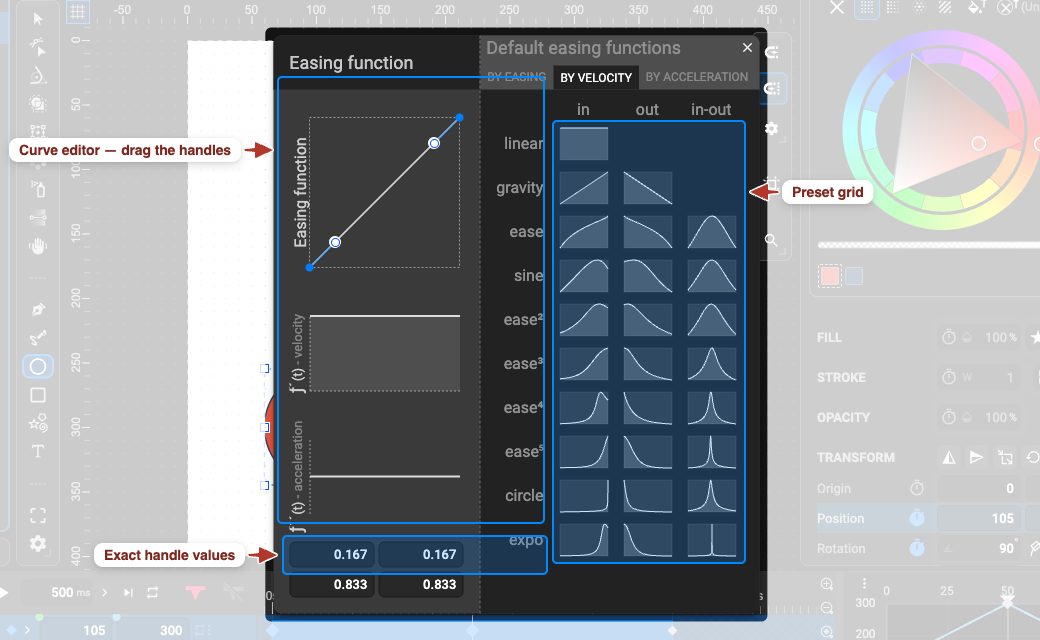
Section titled “Easing Presets”The right half of the Easing Function panel is a grid of presets — rows are curve families, columns are the in, out and in-out variants. Click a cell to apply it.
| Preset | Feel |
|---|---|
| linear | constant speed — mechanical, good for spinners and conveyor motion |
| gravity | falls like a dropped object (fall) or rises and slows (rise) |
| ease | gentle, all-purpose |
| sine | soft and fluid |
| ease² · ease³ · ease⁴ · ease⁵ | quadratic to quintic — increasingly snappy |
| circle | arc-shaped: fast, then a sudden stop |
| expo | dramatic — very fast then very slow, or the reverse |
in accelerates at the start, out decelerates into the end, in-out does both. The tabs above the grid — By Easing · By Velocity · By Acceleration — only reorder the rows.
Rule of thumb: out for things that enter or come to rest, in for things that leave, in-out for things that move from one place to another and stay in view.
Editing Curves
Section titled “Editing Curves”The left half of the Easing Function panel is the curve editor:
- Drag the Out handle (start side) and the In handle (end side) to reshape the curve; the canvas and the Chart Panel update live.
- Type exact values in outX · outY · inX · inY for precision or to copy an easing from elsewhere.
- Switch the preview between Easing function, ƒ′(t) velocity and ƒ′′(t) acceleration to judge the motion in a different way.
- Start from a preset, then adjust — most custom curves are a preset with one handle pulled.
You can also drag the handles directly in the Chart Panel, which is handy when comparing the segment with other properties’ curves.
Flip Selected Keyframes (timeline ⋮ menu) reverses selected keyframes in time, so an ease-in motion becomes its mirror-image ease-out — useful for symmetric back-and-forth motion.